How to make a paper spectroscope with a scale
There are many instructions on the Internet for making a spectroscope using a paper box and a CD. However, they all serve only to demonstrate that white light is decomposed into a color spectrum by means of a diffraction grating. Therefore, I created my own, which can be realistically measured. This article contains instructions for its production and measurement examples. The spectroscope can be used to manually measure the wavelength of light, or in combination with a telephone or camera to evaluate spectral curves, making the manual spectroscope a digital spectrometer.
How does it work
If a plane light wave strikes an obstacle (the magnitude of which is comparable to the wavelength of light), a light diffraction occurs at that obstacle. The diffraction grating contains thin light and dark stripes that act as miniature obstacles. After the light passes through the light streaks, light scattering occurs in all directions, with the light waves folding (interfering) at a certain angle. Light waves v with different wavelengths (color) continue at different angles after passing through the diffraction grating. Thus, the white light bends on the diffraction grating and decomposes into individual rainbow colors.
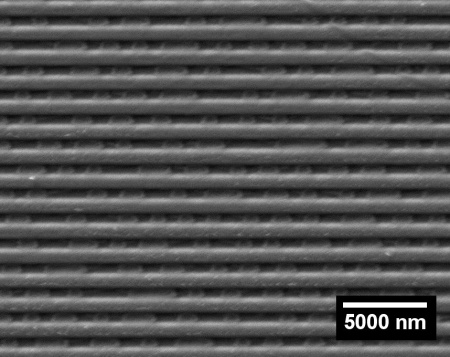
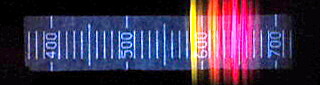
We can also consider a compact disk (CD) as a diffraction grating. Contains thin bars on which data is recorded. The image above is a photograph of a CD from an electron microscope. The spacing of the centers of the individual bands is 1600 nm, which in conversion corresponds to the density of the diffraction grating of 625 lines / mm.
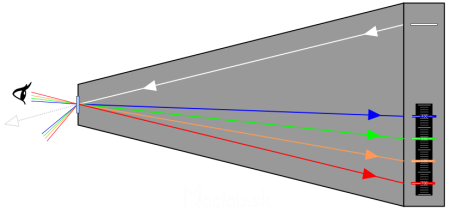
The paper box of the spectroscope serves as a dark chamber into which a narrow strip of white light penetrates through the slit. The light hits the diffraction grating from the CD. The grating of different wavelengths (colors) of light at different angles occurs on the grating. When looking through a diffraction grating (eyepiece) into a dark chamber, the colored diffraction lines are projected to scale in the dark chamber. On the scale, we can measure the wavelength of a particular color of light. The image above is not only illustrative, but shows the actual angles for the diffraction grating from the CD.
Instructions for making of the spectroscope
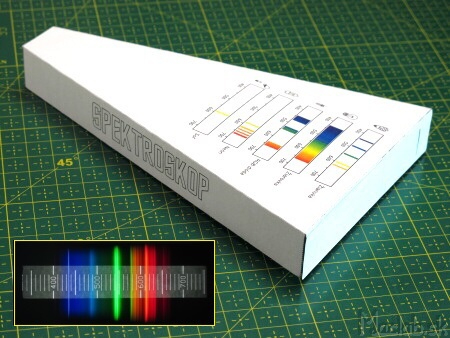
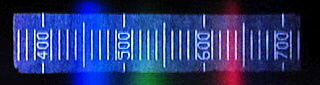
With the help of the free eye, we can observe wavelengths in this spectroscope from approximately 400 to 700 nm. The resolution is 10nm. Those with sharp eyesight can reach the level of 5nm. The accuracy of measuring the absolute value of a particular wavelength depends on the initial calibration.

Download the PDF file and print it on A4 office paper.
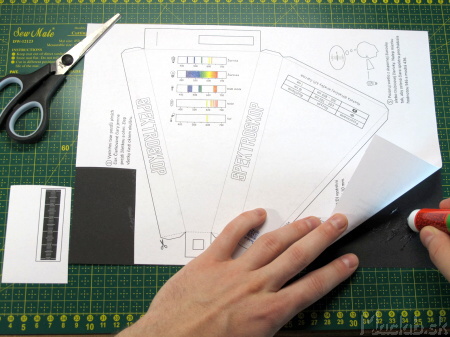
Cut out the scale and set it aside. Cover the remaining area with thick black paper and let it dry thoroughly.
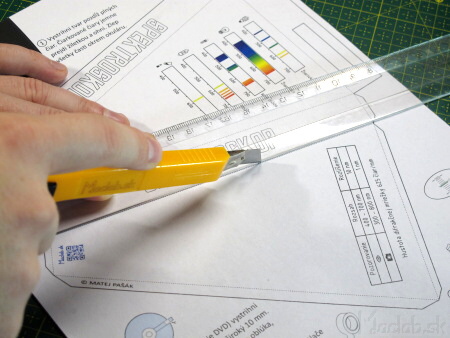
Cut out the shape from the paper along the thick lines. Gently pass the dashed lines through the razor blade and bend. The light entry slot should be approximately 0.3mm wide. The edges of the slit should be as straight as possible. The quality of the spectral line display also depends on this.
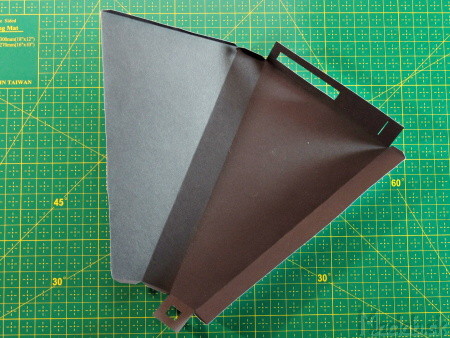
After cutting out the shape, glue all the parts except the eyepiece.
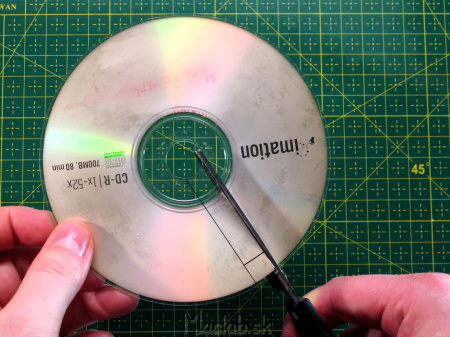
We will use CD as the diffraction grating (not DVD - it has a different grating density). Mark a square of approximately 10x10 mm and cut it out of the CD with scissors. Cutting is easier when we heat the CD a little under the lamp.
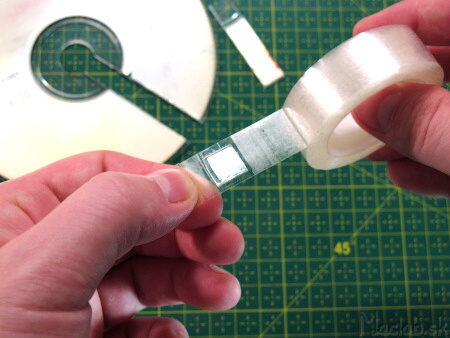
We will stick adhesive tape on the side of the print.
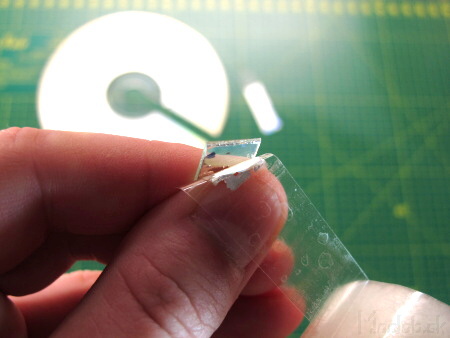
We tear off the adhesive tape with the print and we get a transparent piece of plastic. We clean the exposed surface and no longer touch it with our hands, so that the diffraction grating is not destroyed.
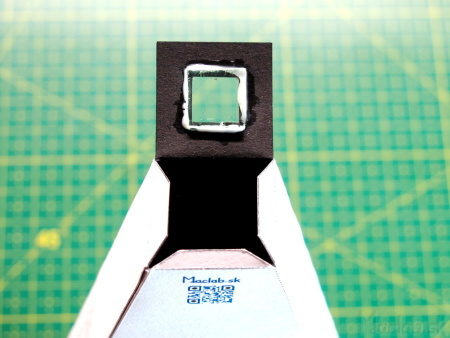
Glue a piece of CD into the window of the eyepiece so that the arc of the original CD is parallel to the slot. The orientation of the bow is indicated on the right side of the eyepiece from the outside. Close the eyepiece window without gluing, point it at the fluorescent lamp and check that the spectral lines are parallel to the slit. If the lines are curved, adjust the position of the CD by turning it slightly, until the glue has not completely dried yet. If everything is in order, stick the eyepiece window firmly.
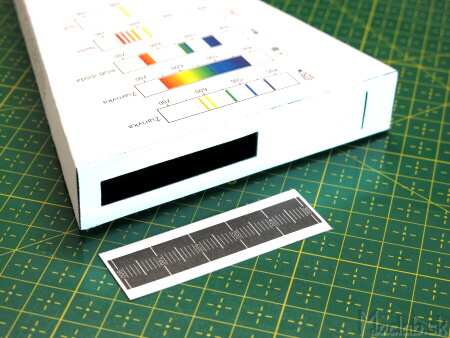
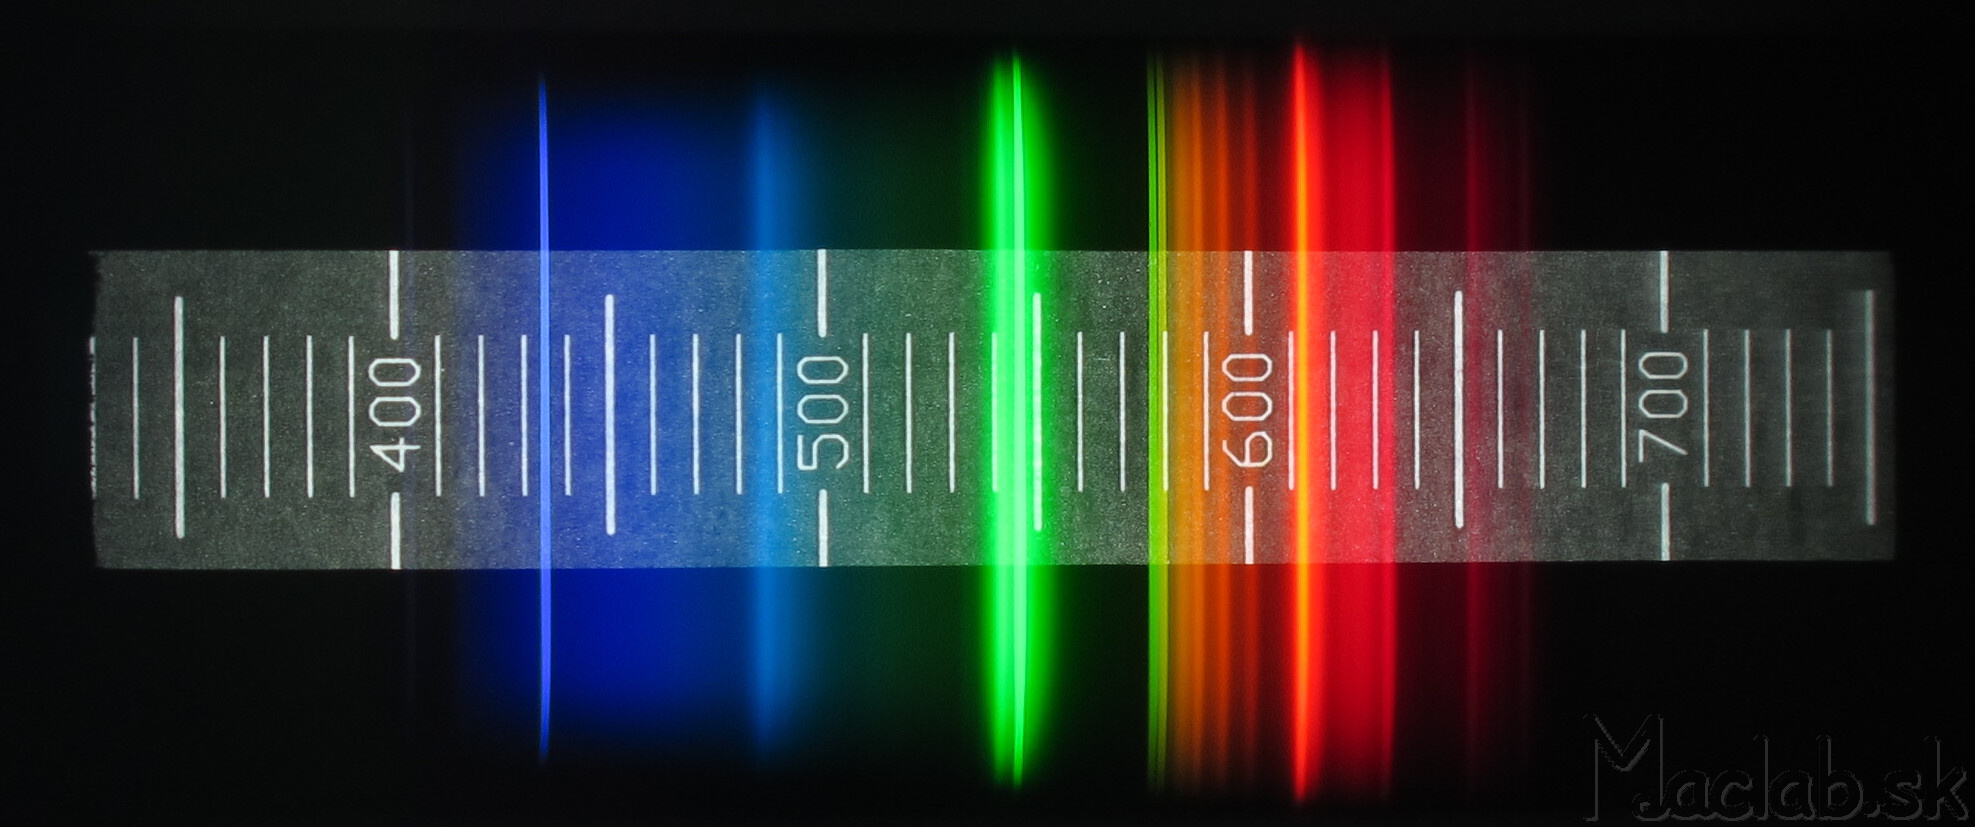
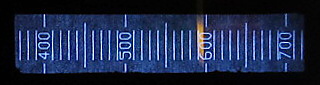
The scale itself should be made of thin paper so that some light shines through it to read the scale. If you have the opportunity, you can print the scale on a transparent foil. We have to glue the scale in the right position - calibrate.
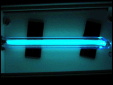
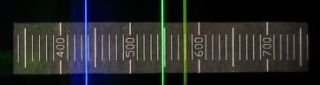
We perform the calibration by pointing the spectrometer at the fluorescent lamp and gluing the scale in such a position that the blue line of the spectrum passes as accurately as possible with the value 436 and the green line 546.
With this spectroscope you can:
- Observe the decomposition of white light into a spectrum of colors
- Observe discrete emission and absorption spectra
- Observe the Fraunhoffer lines
- Measure the wavelength of a particular light color
- Measure the range of wavelengths that a particular person can see
- Measure the range of wavelengths emitted by a light source
- Identify the composition of the gas light tubes
- Identify some elements using a flame test
- Identify some metals using spark spectra
- Analyze spectral curves as a dependence of intensity on wavelength
- Determine the transmittance value of optical filters
- Identify some elements in the atmosphere by absorbing light
- Convert wavelength from nanometers to frequency or Antremes
- Measure the surface temperature of the sun or some black bodies
Creating a spectral curve from a photo
This paper spectroscope is primarily taught for manual measurement, but if we attach a camera to the spectroscope eyepiece, we can record the measurement as an image. This image can be further digitally processed to create a spectral curve (profile), making the spectroscope a spectrometer. The spectral curve is a graphical dependence of intensity as a function of wavelength. Simply put, a certain color of light has its wavelength, and intensity is energy (brightness) at that wavelength.
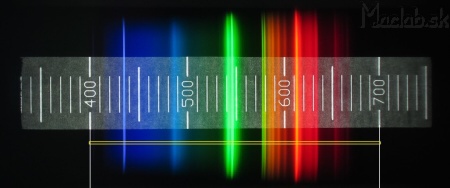
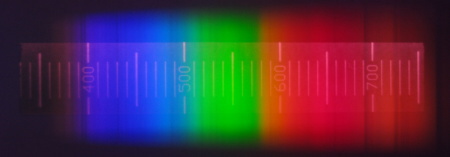
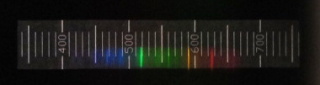
For the spectral profile, it is necessary to select an area out of scale from the original image. In MS Paint, we draw thin white lines at the 400nm and 700nm positions. Crop the image to the width of the lines and the height of 1 pixel.
![]()
Use the resize command to expand the height of the image to 200 pixels, while maintaining the width. We get perfectly parallel spectral lines.
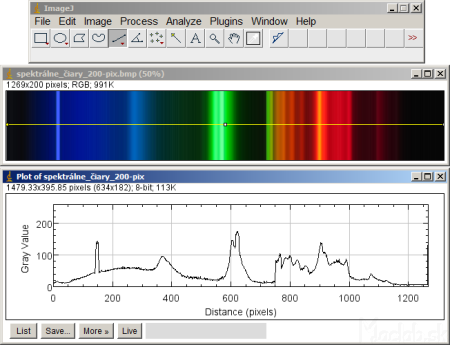
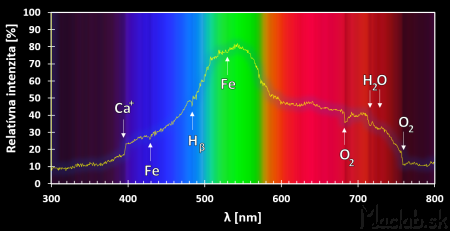
There are several programs to evaluate the brightness of spectral lines. I used ImageJ. Use the line icon to draw a horizontal line across the entire image. From the menu, select: Analyze - Plot profile. An intensity curve is plotted against the position of the pixels. Continue with the Save button and save the measured values to a text file.
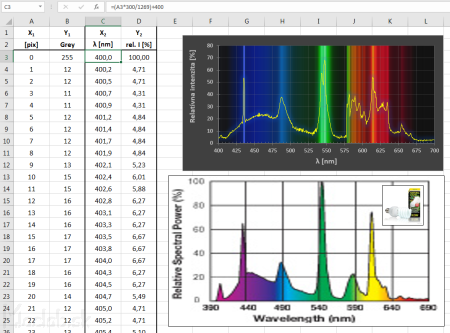
Measured values from a text file can be processed in a spreadsheet. I used Excel. The first column is the position of x in pixels. My image has a line width from line to line of 1269 pixels, in the wavelength range 700 - 400 = 300 nm. So we recalculate the pixels on the nanometer over 300/1269 = 0.236 nm / pix and add the initial value of the line 400 nm.
The second column of the measured data expresses the intensity in shades of gray, where 0 is completely black and 255 is pure white. We convert these values to percentages so that the value 255 forms the basis of 100%. We get the relative value of the intensity. We will display the recalculated values in a graph. As the background of the graph, we select the analyzed image of spectral lines. The picture above compares my spectral curve with the manufacturer's specification for the Exo-Terra-Natural energy-saving lamp.
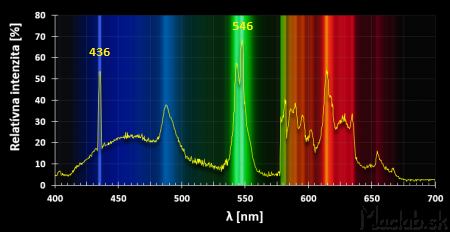
The fluorescent lamps contain mercury with a typical emission spectrum of blue 436 nm and green 546 nm. Other colors are achieved by adding other elements, together creating white light.
Fraunhoffer lines
I evaluated the sunlight in a similar way. I did not aim the spectrometer directly at the sun because the light was too intense. I caught a diffused light from the cloudy sky.
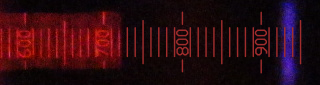
I used a camera with the cut-of filter removed, so the captured light is in the range of 300 - 800 nm.
The sun emits a continuous spectrum in which there are dark bands - Fraunhoffer lines. These are the result of the absorption of light by the chemical elements present in the chronosphere of the Sun and the atmosphere of the Earth. The absorption wavelengths for the individual elements are generally known table values.
Black body temperature measurement
An absolutely black body is a body that does not reflect any light. If we heat such a body, it will automatically emit a continuous spectrum of light. First with a predominance of infrared radiation, then visible light and at high temperatures up to ultraviolet radiation. Like heating a metal. At low temperatures it is red, at higher temperatures it is yellow and at very high temperatures it is hot to white.
For a particular black body temperature, there is a value of maximum intensity at a particular wavelength in the continuous spectrum. Therefore, we find the maximum from the spectral profile and assign a temperature to it. However, the maximum in the visible spectrum is only for the temperature ranges 3500 - 6500 ° C. Related to this is the determination of the temperature of the light source in Kelvin. That is, whether warm red or cold blue predominates in the spectrum.
The sun can also be considered a black body, because light only radiates and does not reflect. From the analysis of the solar spectrum I obtained a maximum at 540nm which corresponds to a temperature of 5367K which is in terms of 5094 ° C. The surface of the sun therefore has a temperature of the order of 5000 ° C.
Real-time video analysis from a spectroscope
If we capture the image of the spectroscope using a webcam, we obtain video spectra in real time. Real-time spectrum analysis only makes sense if the spectrum changes over time. For example, during heating of the lamp after switching on.
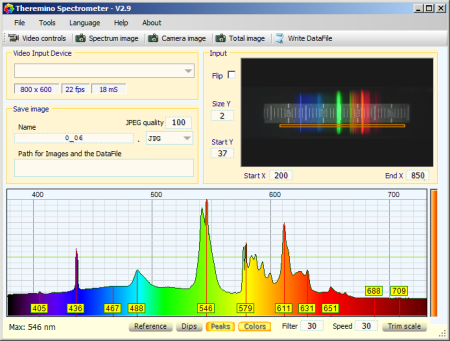
The excellent Theremino Spectrometer program is used to evaluate the video from the webcam. It includes calibration and various display options.
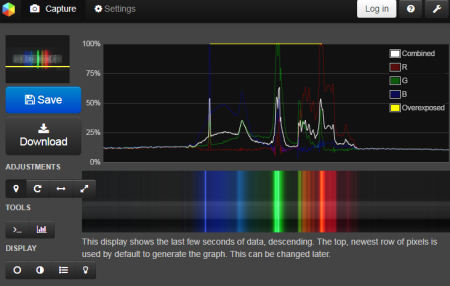
Another option is to use the online Spectralworkbench application. Its advantage is that it does not need to be installed. On the contrary, the disadvantage is that it is necessary to register for calibration.
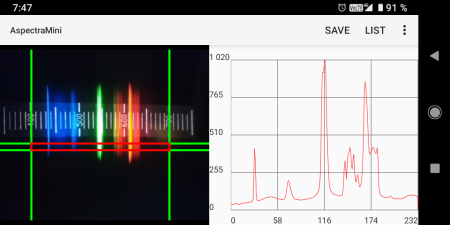
There are also several applications for Android directly for processing in the smartphone, such as the simple AspectraMini.
Personally, I don't use video spectrum analysis much. If I need to record a change in spectrum over time, I set the camera to shoot sequentially at regular intervals. Another disadvantage of image processing through the camera is that if I move the camera relative to the spectroscope, I have to perform wavelength calibration again. In addition, the video resolution and exposure are worse than for large format photography, which affects the resolution of the spectroscope.
Spectra of light sources
The following are examples of the spectra of various light sources. In very low light I had to use high ISOs and therefore there is a lot of noise in them.
 |
 |
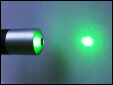
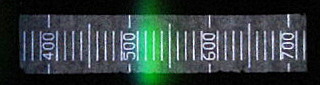
Green Laser with a defined wavelength of 532nm
 |
 |
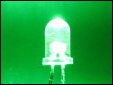
Green LED
 |
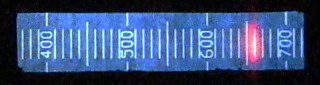 |
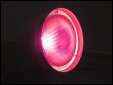
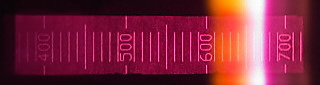
Red laser
 |
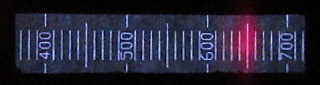 |
Red LED
 |
 |
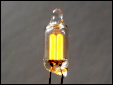
Infra lamp
 |
 |
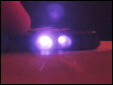
Infrared LED remote control on the TV
 |
 |
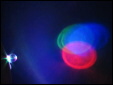
RGB LED dide
 |
 |
Sodium lamp (Na)
 |
 |
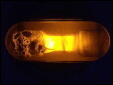
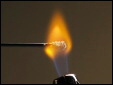
The salt (NaCl) turns the flame orange
 |
 |
Neon crucible
 |
 |
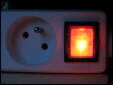
Illuminated extension switch
 |
 |
Ultraviolet UVC lampp
Spark spectra
Light from conductive materials can be excited by a spark. Different materials produce sparks of different colors and we can analyze this light. However, the sparks are very faint and mix with the blue light of the electric arc itself.
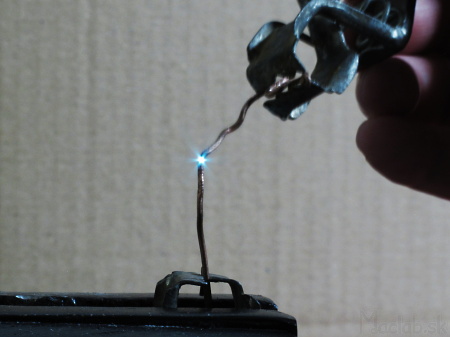
I used a 12V / 5A car charger as a current source.
 |
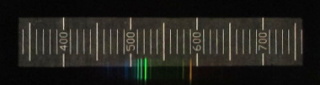 |
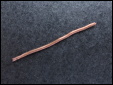
Spark spectrum of copper wiring wire
 |
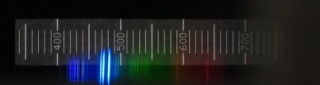 |
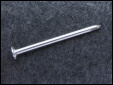
Steel nail
 |
 |
Aluminum from a tea candle